Reading your analytics: CTR, CR, AOV, GMV
In Trendweave you have four numbers worth looking at every week: CTR, CR, AOV, GMV. Don't confuse them with the ten other metrics that mean nothing at your volume. These four cover 95% of 'why did I earn so much today and half that last week?'
CTR — Click-Through Rate
Share of viewers who clicked your link after seeing the post (through DM automation). Computed as clicks ÷ post views. A healthy CTR in Indian fashion is 1–3%; below 1% means a weak hook or weak cover; above 3% means your Lesson 13 levers are working.
CR — Conversion Rate
Share of clickers who placed an order. Computed as orders ÷ clicks. A healthy CR in fashion is 2–6%; below 2% means the product doesn't match the audience or the price is above their wallet (Lesson 12); above 6% means you've got a 'hot' product — build 5–10 more posts around it.
AOV — Average Order Value
Average order amount. Useful for understanding how much GMV one click brings. Often low CR + high AOV yields better commission than high CR + low AOV. Don't blindly optimise for 'more clicks' — optimise for commission per post.
GMV and commission — what you actually earn
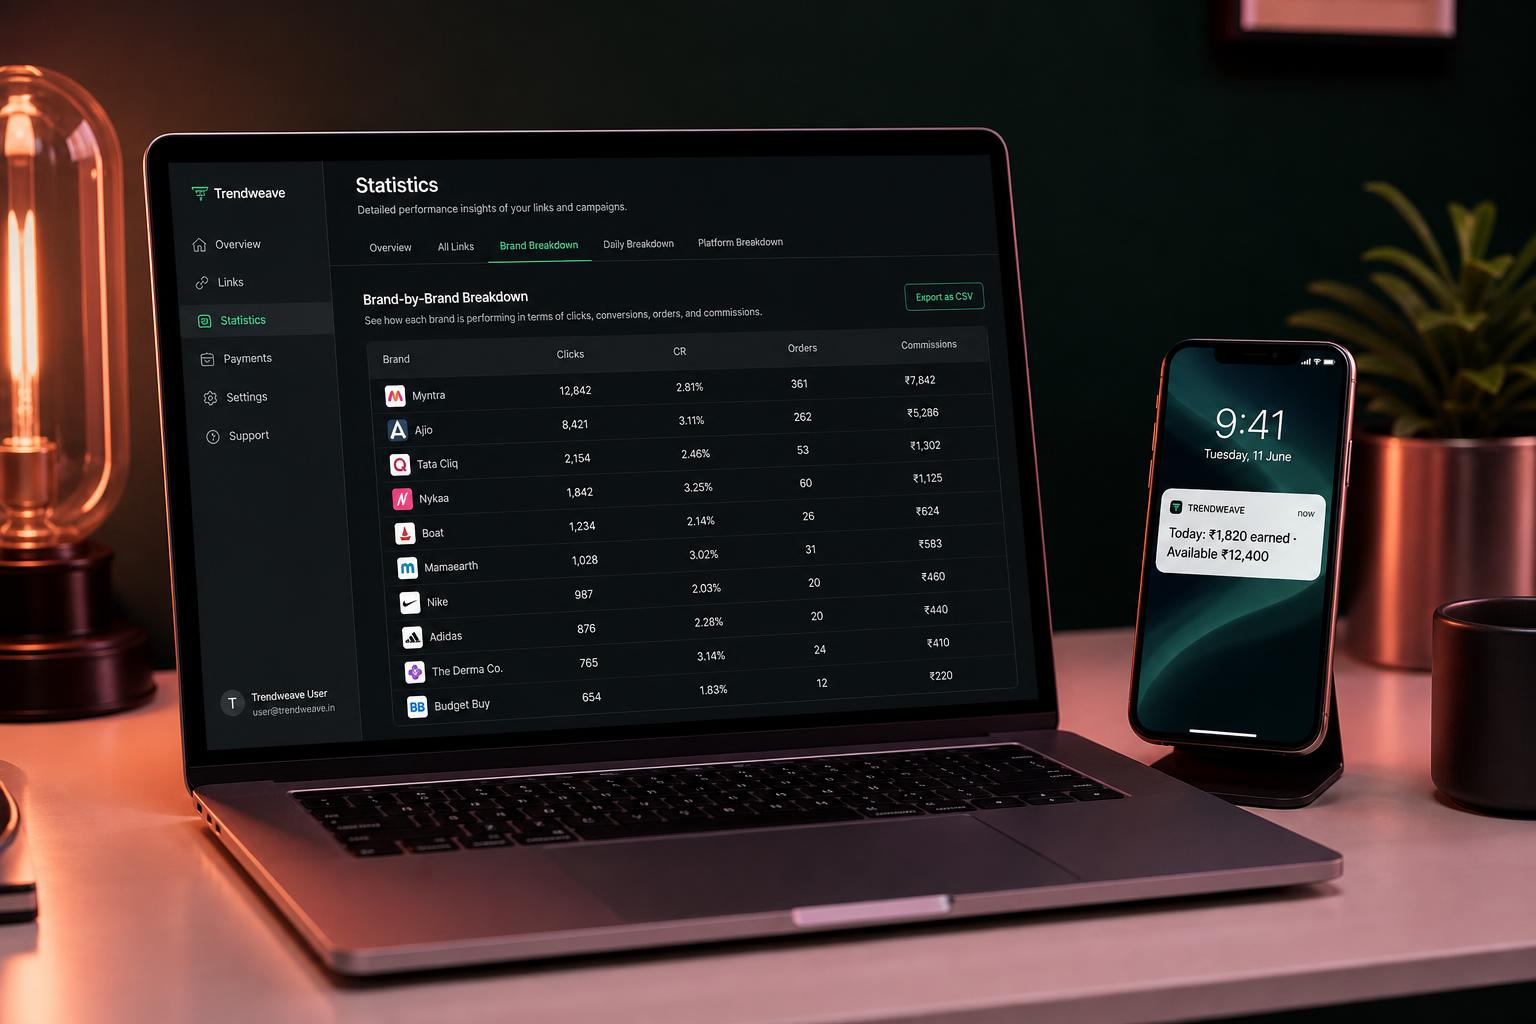
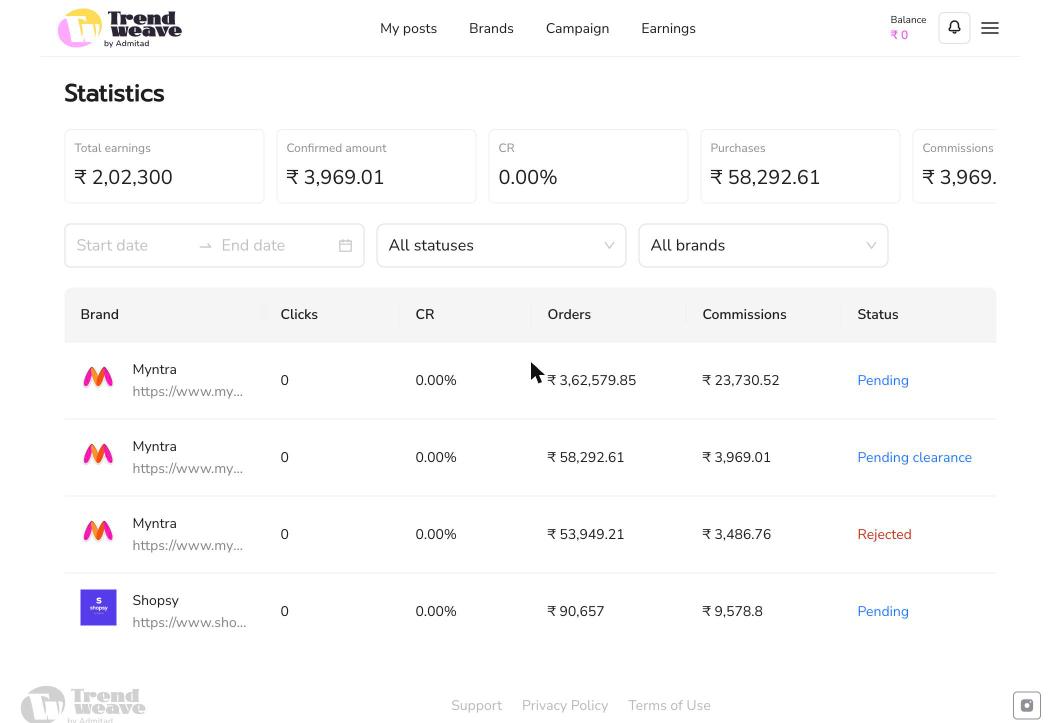
GMV (total order value) × the retailer/category rate = commission. The Statistics section shows GMV by brand and status (Pending / Pending clearance / Rejected). Watch the Confirmed column — that's the money definitely heading your way.
What to do every week
Open Statistics at week-end, filter to 7 days. Find your top-3 posts by commission (not by clicks — by commission). Note what they have in common: one category? one hook? one cover? That's your next-week formula. Repeat.
Key takeaway: Good analysts look at one number a week and make one decision. Bad ones look at 30 metrics and do nothing. Stage 2 is the 'one decision a week' mode.
Next step: Open Statistics → filter 7 days → find top-3 posts by commission → note what they share. That shared pattern is your next 5 posts.
- Learning outcome
- You can read your dashboard and name 2 growth points.
- Action in product
- Fill the "my 2 growth points this week" mini-form.
- Success metric
- ≥60% fill the form.
- Unlock / Reward
- Personalised growth board.
- Format
- 5-min video + dashboard.